4.1.5. Excitation sequence in microstep stepper motors
The excitement of a hybrid can be symbolized by a polar diagram (Figure 4.10). A complete cycle (360 electrical degrees) of the signal generated by the phases exactly four steps. A full step is equal to 90 degrees to the electrical signal. The representation of the current through the windings IA and IB is housed on the axes of x and y coordinates respectively, at an angle of 90 degrees, which corresponds to the angle of the mechanical arrangement of the stator poles in relation to a step. So magnetic fields generated by the motor phases form a 90 degree angle to each other, looking section 2.3. (Hybrid engines). The intensities IA and IB can take discrete values 0, + i-i, i corresponding to the maximum current phase.
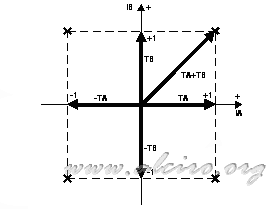
Figure 4.10. Polar diagram of the current through the phases and the resulting torque of a hybrid engine.
The torque is proportional to the current through the motor winding, and the resulting torque is the sum of the individual pairs produced by the current of phase A and phase B. The torque direction is determined by the direction of current flow. In Figure 4.10 we see that for a single excitation of one of the phases produces a torque proportional and the same direction as the excitation current, for example, have excited the A phase with a current + i the pair generated phasor is represented by the name T A, in the same direction as the intensity. The same happens if we excite the B phase, the resulting torque vector is represented by T B. If both phases are excited at the same time (phase I and phase A = + B = + i) each of which produces a torque T A and T B in the directions for the flow intensity, and the resulting torque is the sum of these vectors, symbolized by the vector T A + T B.
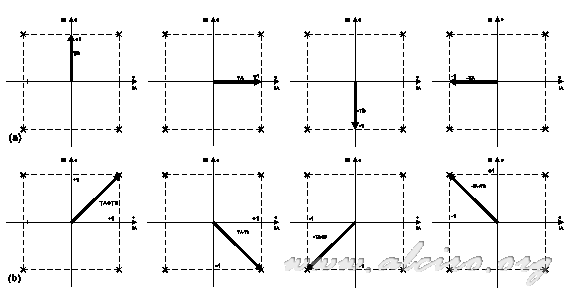
Figure 4.11. Polar diagram for the excitation sequence of an active phase (a), two active phases (b).
In the excitement discrete 0, + i and-i for the values of the current vector pair has four positions in the polar plot, each corresponding to a full step. Figure 4.11 shows the available torque vector and intensity through the phase excitation sequence for an active phase (a), and a sequence of two active phases (b). In these charts we can see the difference in the resulting torque when working with each type of excitement. For the half-step operation, the positions of the resulting vector is twice the full step and correspond to the sum of the positions shown in Figure 4.11 (a) and (b) of intercropping.
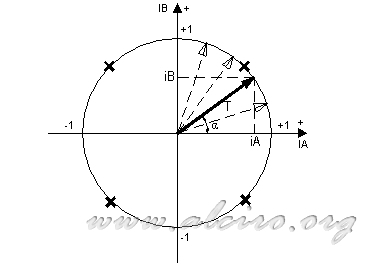
Figure 4.12. Projections and vector path pair for a constant magnitude.
If the resulting torque vector is the sum of two vectors of individual phase, and these are proportional to the current flowing through them, adjusting the value of this intensity can cause the resulting vector angle α adopt a different , between 0 and 90 electrical degrees or the angle of a step. And adjust the resulting torque. In the excitement of a half-step intensity control in a discreet, there is a difference between the torque produced by an active phase with two active phases. To get the torque is constant at all times, we take the vector T for the total torque produced by the engine and we rotate a circle with center at the coordinate axis (Figure 4.12). The projections of this vector on the axes of x and y coordinates represent the excitation currents of phase A and B, respectively, to achieve constant torque at any instant. These projections form a sinusoidal wave, 90 degrees out of phase with each other.
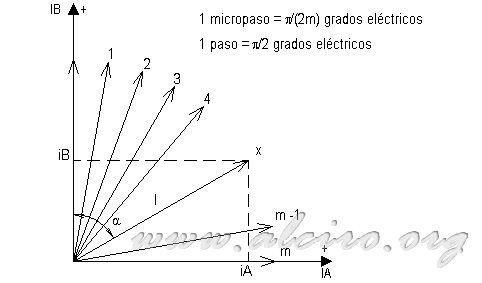
Figure 4.13. Polar diagram for a sequence of microstep.
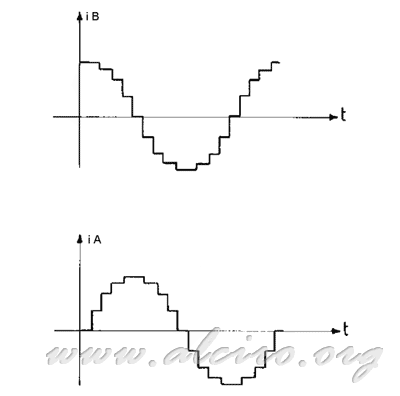
Figure 4.14. Waveforms of current through the windings to a sequence of four microstep per step.
Figure 4.13. shows a polar diagram of a step equal to π / 2 electric degrees. This is divided into m discrete microstep. If we take the discrete value independent variable x for the number of microstep. With the module corresponding to the maximum intensity I. The intensity value for each phase i A i B is the result of projecting the vector x, with an argument α that corresponds to the number of microsteps by a microstep angle (x (π / (2m)) on the axes coordinates.
\ =\ \frac{i_A}{I}\ \ cos(\alpha )\ =\ \frac{i_B}{I}\\ i_A\ =\ I*sin ( \frac{\pi }{2*m}*x )\\ i_B\ =\ I*cos ( \frac{\pi }{2*m}*x )) (4.1)
(4.1)
The values of i A i B must be as accurate as possible, since the microstep position reports directly to the value they have. For example, if we get four microstep per step (m = 4) with an intensity value I, we apply the formulas i A i B of the equation 4.1, giving a discrete value to the variable x = 1, 2, 3 , 4, 5 ... for each microstep. We obtain a sequence of intensity for each phase as shown in Figure 4.14.
Although the number of microstep per step can be a very high range, microstep the order of 100 or even more, a ratio of greater than (25-32) no advantage microsteps measurable. Figure 4.15. Shows the response of an engine working at full pace in top waveform, and working microstep (lower wavelength). With the sequence of motor microstep movement is practically linear, and disappearing bumps in the mechanical oscillations.
It should be borne in mind that there is no linear relationship between a sufficiently precise outline of sinusoidal waveform and a precise angle microstep. The reason is that there is usually an inhomogeneous magnetic field between the two fields of the rotor and stator.
In case the engine to operate at high revolutions, it is more convenient to work only in full steps, because the harmonic control and is not an advantage because the current in the motor winding has only a triangular waveform.

Figure 4.15. Waveforms of the response of an engine in a full step sequence (top) and microstep (bottom).


